Measure Types
Quantitativedata are represented by Measures of values or counts; this data is numeric and can be used for calculations and statistical analysis. Examples of measures include columns like sales, costs, and margin.
Conversely, qualitative data are represented by Members; this data is categorical or descriptive, rather than numeric, and may be represented by a name (such as Bikes) or numeric code (like a transaction ID). Building queries in Discover requires the user to add both measures and members, thereby supplying both the numeric variables and the qualitative variables.
You can make changes to measure columns by changing the aggregate type, or assigning an aggregate type to columns which haven't automatically been defined as measures.
To assign an aggregation type to a column, simply click the drop-down in the Measures column and select the required aggregation. Measure aggregations can be assigned to columns from both Tables and Columns in Data Modeling. The type of measure applied to a column will determine the aggregation of that column. The available measure aggregation types depend on the column's data type.
Note: a column does not need to be visible to be used as a measure. In fact, columns used for measures should not be visible in the model. As such, the heuristics in Pyramid that auto select which columns to be used as measures will generally also makes the same column invisible in the model by default.
Aggregations
For Numeric columns, select from the following aggregations:
- Average: takes an average of the values in the column
- Count: counts all the values in the column
- Distinct Count: counts the distinct values in the column
- Maximum: takes the maximum value in the column
- Minimum: takes the minimum value in the column
- Standard Deviation: takes the sample standard deviation in the column
- Standard Deviation Population: takes the population standard deviation in the column
- Sum: adds the values in the column
- Variance: takes the sample variance in the column
- Variance Population: takes the population variance in the column
- Cumulative: uses the Sum function to show cumulative values when a date-time hierarchy is added to the query.
- First Child: takes the first instance at the lowest level of the regular hierarchy for that parent.
- Last Child: takes the last instance at the lowest level of the regular hierarchy for that parent.
Text columns may be used to generate the following measures:
- Count: counts all the values in the column
- Distinct Count: counts the distinct values in the column
- Maximum: takes the maximum value in the column
- Minimum: takes the minimum value in the column
- Text: aggregates by concatenating the text strings from the column, separated by a comma and a space.
Date and Time columns can may used to generate the following measures:
- Count: counts all the dates in the column
- Distinct Count: counts the distinct dates in the column
- Maximum: takes the maximum date in the column
- Minimum: takes the minimum date in the column
How to Set the Measure Type
The measure type can be set from both the Tables panel and the Columns panel. There are 2 ways to set the measure type from the Tables panel.
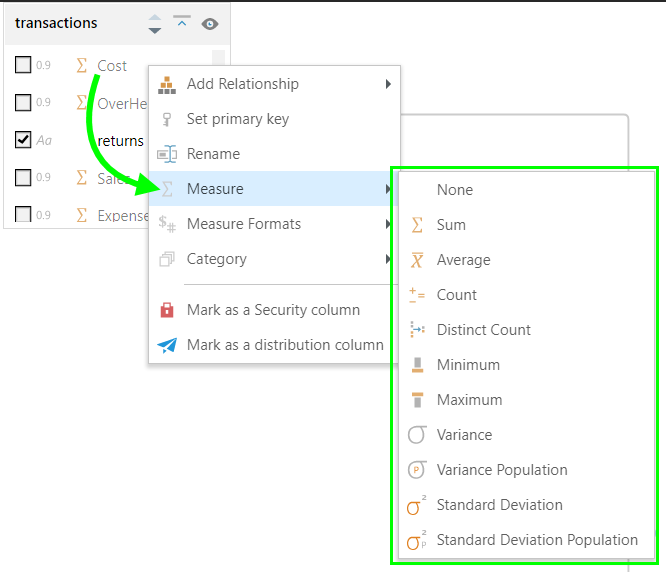
Column Context Menu
Left click on the measure column to open its context menu; go to the Measure sub-menu and select the measure type.
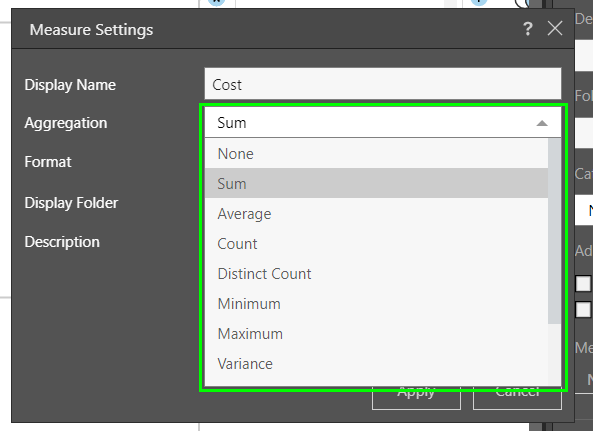
Measure Editor
Left click on the measure from its table to open its Properties panel. Under measures, open the Measure Editor and set the measure type from the Aggregation drop-down list.
- Click here to learn more about the Measure Editor.